Credits: Biovision-Infonet
Viability Analysis
One way of evaluating whether an opportunity such as a new aquaculture investment is worthwhile in the long-term, or to choose between aquaculture opportunities which vary in size, is by use of capital budgeting. Popular methods of capital budgeting include net present value (NPV), and internal rate of return (IRR). Pay-back period (PBP) and the break even point (BEP) are also used as indicators of feasibility of investments.
Net Present Value (NPV) is used in the analysis of the profitability of an investment or project to give indication of the today’s value of what will be earned in future. It is the futures net cash inflows discounted to today’s value. If the NPV of a prospective project is positive, the project is profitable but if it is negative, the project should be abandoned because cash flows will also be negative. The higher the NPV value, the more profitable an investment is.
NPV is given as:
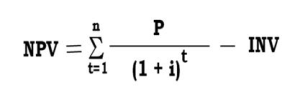
Where:
P = The net cash flow
i = The interest rate or the marginal cost of capital
t = Expected project life
INV = Initial investment
In addition to the formula, net present value can be calculated easily using tables, and much easier by use of computer soft wares like the Microsoft Excel spread sheet.
Internal Rate Of Return (IRR) indicates the estimated rate of return that a project is expected to generate to an investment. This can be viewed as the efficiency of an investment to turn profit.
IRR is the interest rate at which the NPV is zero. It equates the present value of the expected future cash flows or receipts to the initial investment. Equation used for IRR is that for NPV, it is solved for i, the interest rate at which NPV = 0.
IRR can be calculated easily by use of computer software like the Microsoft Excel spread sheet.
When evaluating possible investments options, it is important to remember that the NPV method is better that the IRR. The major limitation of IRR measurement is that it uses one single discount rate to evaluate every investment. However, discount rates do change significantly and therefore without modification, IRR evaluation will not be adequate for long-term projects for which discount rates are expected to vary.
Pay Back Period (PBP) is the time required to recover the cost of an investment through the net cash revenues it generates. It is calculated by dividing the initial investments cost by the accumulated profits before depreciation. However, this analysis does not take into consideration cash flow after the payback period. This method should only be used therefore as a first approach at the initial stages of evaluation to give an indication of the payback period and may not be relied upon to rank investments on basis of viability. PBP is given as:
PBP=I/E
where:
PBP = payback period in years
I = initial investment
E = Accumulated profits before depreciation
Break even Point (BEP) describes how much a project must produce to cover for the total cost of production. At the BEP, the revenue generated by a project equals the total cost incurred. An investor will need to know this to weigh this against production possibilities available. However, this method like the PBP should only be used as a first approach before proper evaluation is conducted because it does not show profitability of projects.
BEP considers the Economics of Scale which means the quantity of fish needed to be produced and sold at the current market price to pay all cost of the operation and make enough profit for the owner. In general the smaller the system, the more it costs to build and operate per quantity produced. This is because certain fixed costs remain the same no matter how much fish are produced.
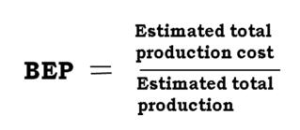
For aquaculture investment, BEP can be derived for production quantities and produce prices. BEP analysis for production quantities is derived by calculating how much an enterprise should produce per hectare, considering the estimated market prices for the products, to be able to cover for the total production cost. The BEP for the produce prices is calculated by deriving the price at which the produce must be sold to cover the total cost of production.
BEP for production quantity is given as:
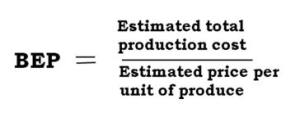
BEP for produce price is given as:
Financial ratios are used to give an indication of not only how likely a project will turn a profit, but also how that profit relates to other important investment characteristics of the project. High revenues alone do not necessarily translate into profits for the investor. A project must have the ability to clear all of its expenses and costs. These ratios are used to assess a business’s ability to generate earnings as compared to costs incurred during a specific operation. They provide a comparison of profits generated and what have been invested in a project. For most of these ratios, having a higher value is an indication that the investment is good. Such ratios will include return on investment, return on equity, return on asset and operating profit margin ratio.
i). Return On Equity (ROE) indicates how much profit an investment generates with the equity.
ii). Return On Assets (ROA) is an indicator of how profitable an investment is relative to its total assets.
iii). Operating Profit Margin Ratio (OPMR) gives an indication of how much of the gross income is actually profit.
iv). Return On Investment (ROI) gives an indication of how an investment returns relate to the total invested capital.
These ratios are derived as:
i). ROE: Net income from operations divided by total equity
ii). ROA: Net income from operations divided by total
iii). OPMR: Operational gains plus interest divided by Gross income
iv). ROI: Net income from operation divided by Debts plus capital
Sensitivity of
an investment to aspects of production is very important. Some of these
aspects can be very volatile and their changes might have enormous
effects on the profitability of projects. For investors to be able to
make choices on where and how to invest, they need to know how likely
variations on production output, cost of inputs or even changes in the
market prices for the products will affect their future cash flows and
net incomes. To be able to carry out a proper sensitivity
analysis, an entrepreneur needs the following information for each of
the investment type:
Capital investment costs estimates:
- a) Cost of land
- b) Cost of construction of buildings and fish production facilities
- c) Cost of acquisition of equipment and machinery
Operational investment that included the cost incurred during production. These included:
- a) Quantities of inputs used in production
- b) Cost of inputs of production
- c) Payment of salaries and wages
- d) Costs of taxes, depreciation, permits and licenses
- e) Cost of acquisition of financing
Operational incomes that included:
- a) Products and production quantities
- b) Market price of products per unit value of product
For aquaculture investments, sensitivity can be analyzed by simulating changes (but not limited to) in:
- a) Produce prices
- b) Cost of feeds
- c) Production quantities
- d) Food conversion ratios and
- e) Survival rates of fish species under culture
It is important to point out that there are experts in aquaculture economics in Kenya who can do these analysis for potential investors. Unless the investors are themselves conversant with the analysis, they need not struggle to do them but consult the experts.
Enterprise budgeting
Commercial aquaculture can result in good profits but it can also result in meaningless gains or huge losses. The reasons for failure are diverse but include:
- Over-capitalization
- Improper practices
- Poor planning
- Lack of foresight
- Lack of hindsight
There is no need to start something that you do not know whether it will make intended gains. It is therefore important to find out in general terms, the costs and returns of the proposed aquaculture venture before investment is done. To do this, you need to do a budget of your enterprise to see how it will operate.
An enterprise budget provides information on annual cost, annual returns and capital investment requirements for a particular enterprise. Many farmers budget in their heads and end up making wrong decisions. Good budgets should be written so that they can be reviewed as times goes by. Most of the information needed for a good budget is available locally e.g. past experience, farm plan, agricultural input dealers for input costs, aquaculture product dealers for fish prices etc.
Uses of an enterprise budget;
- It is used by Farm manger as a plan of operation before production
- Can be used as reference during production or after marketing
- It forms basis of a comparison of what really happened versus what was planned so as to inform on improvement
- Aid in cash flow planning, in controlling production costs and in determining the Break Even Prices and Yields
The basic structure of an Enterprise Budget consists of:
i) Gross Receipts
This refers to gross returns or total sales from the farm. It is the income generated from the sale of farm produce e.g. fish, fingerlings etc. They are estimated by multiplying the total expected harvest weight (quantity) with the expected price per unit weight (kg).
ii) Variable costs
This is also referred to as operating costs. These are costs that vary with production or expenses related directly to the quantity of fish produced for market.All production costs/expenses are itemized and they include; Cost of fingerlings, feeds, labour, interest on operating capital etc.Interest on operating capital is a variable cost and is a charged for a loan required to purchase production inputsTotal Variable costs (TVC) is the sum of all variable costs
iii) Fixed costs
These are costs that are incurred regardless of the level of production (operation). They include; depreciation, interest on investment capital and other costs not related to active production of the business e.g. insurance. They are also referred to as ownership costs.
Depreciation refers to an expenditure allocated to a tangible asset’s cost over its useful life. Depreciation is a non-cash expense and therefore it increases free cash flow while decreasing reported earnings. It is used in accounting to match the expense of an asset to the income the asset helps an investment earn. For example, if a farmer buys equipment for KShs 10,000 and expects it to have a useful life of 10 years, it will be depreciated over 10 years. Every year, the farmer will expense KShs 1,000 (assuming straight-line depreciation), which will be matched with the money that the equipment helps to make each year. Depreciation applies only to items that have a definable useful life.
Total fixed costs is the sum of all fixed costs.
Net returns: This is the difference between gross receipts and total costs which is the indication of the amount of profit earned.
Returns above variable costs
- This is the difference between the GROSS RETURNS and the TOTAL VARIABLE COSTS.
- If this figure is positive, it means that all variable expenditures are covered and the enterprise is profitable at least in the short run.
- If they are negative, it is advisable to close the business if you can not reduce on the variable costs
Net returns
- This is the difference between the TOTAL COSTS and the GROSS RETURNS.
- Positive returns indicate that the enterprise is profitable even in the long term while negative returns indicate that the enterprise is not viable and should be abandoned if you cannot reduce on the costs.
Table 1: An enterprise budget for a hypothetical fully operational tilapia /catfish farm
- Farm size: 0.5 Ha
- Productivity: 3 kg/m2/year
- Av price of fish in KES/Kg: 250
| Item | Description | Unit | Unit price (KES) | Quantity | Total Amount |
| Gross Receipts | |||||
| Tilapia | Whole fish | kg | 200 | 12,000 | 2,400,000 |
| Catfish | Filet | kg | 300 | 3,000 | 900,000 |
| Gross Receipts | 3,300,000 | ||||
| Variable Costs (VC) | |||||
| Tilapia fingerlings | 1 month old | No. | 3 | 30,000 | 90,000 |
| Catfish fingerlings | 1 month old | No. | 5 | 10,000 | 50,000 |
| Wheat bran | kg | 30 | 35,000 | 1,050,000 | |
| Fertilizers | DAP | kg | 50 | 130 | 6,500 |
| CAN | kg | 50 | 270 | 13,500 | |
| Lime | kg | 20 | 1,300 | 26,000 | |
| Labour | Pond repairs and harvesting | KShs/day | 2000 | 150 | 300,000 |
| Interest on operation loan | KShs | 12% | 500,000 | 60,000 | |
| Total Variable Costs (TVC) | KShs | 1,596,000 | |||
| Net returns above TVC | KShs | 1,704,000 | |||
| Fixed Costs (FC) | KShs | ||||
| Depreciation | Ponds | KShs | 40,000 | ||
| Equipment | KShs | 10,000 | |||
| Machinery | KShs | 30,000 | |||
| Buildings | KShs | 10,000 | |||
| Water supply | KShs | 20,000 | |||
| Interest on capital investment | KShs | 30,000 | |||
| Total Fixed Costs (TFC) | KShs | 140,000 | |||
| TOTAL COSTS | KShs | 1,736,000 | |||
| Net returns above TC | KShs | 1,564,000 | |||
| Net returns/Ha | KShs/ha | 3,128,000 | |||
| Break Even Price | |||||
| Above TVC | KShs/kg | 106.4 | |||
| Above TC | KShs/kg | 115.7 | |||
| Break Even Yield | |||||
| Above TVC | kg/ha/year | 12,768 | |||
| Above TC | kg/ha/year | 13,888 |
Cash flow budget
One useful tool for planning the use of money in an aquaculture enterprise is a cash flow budget. A cash flow budget is an estimate of all cash receipts and all cash expenditures during a certain time period. Estimates are made monthly, bimonthly, quarterly or annually. Estimates can include non-farm income and expenditures as well as farm items. Cash flow budgeting looks only at money movement, not at profitability. Non-cash revenue or non-cash expenses, for example depreciation, are not considered.A cash flow budget is a useful management tool because it:
- Makes you to think through your production and marketing plans for the year.
- Tests farming plans: will it be possible to produce enough income to meet all cash needs?
- Projects need for operating credit and ability to repay borrowed funds.
- Projects when to borrow money and when to repay.
- Helps in control of finances. By comparing the budget to actual cash flow, one can spot developing problems due to an unexpected drop in income or unplanned expenses, and opportunities to save or invest funds if net cash flow is higher than expected.
- Helps communicate farming plans and credit needs to lenders.
Items to be included in a cash flow budget include:
- Receipts from sales
- Operating cash expenses
- Living expenses
- Other expenses e.g. Personal withdrawals
- Debt interests and payments
- Capital sales
- Capital purchases
- Income tax payments
Each type of revenue is charged during the specific period when it is occurred.Cash flows differ depending on the purpose for which the analysis is being developed. You could have:
- Monthly cash flow budgets – for detailed financial planning
- Quarterly budgets – to develop estimates of cash needs over a several year period
- Annual budgets – used in investment analysis to determine cash flow over the life of the investment
Components (items) of a cash flow budget
- Beginning cash balance (BCB) – this is the amount of cash at hand at beginning of the production period.
- Receipts – cash revenue generated by sales of the crop or capital assets.
- Note: cash revenue items (receipts) + BCB are summed up to obtain Total cash inflow for the time period
- Operating cash expenses – expenses related directly to the quantity of fish produced. e.g. fingerlings, feeds, field labour, security personnel, repairs etc.
Also expenses associated with the purchase of capital assets or breeding stock are included.
- Living expenses – this Includes what the owner of the enterprise spends on the self which can be referred to as nonfarm investments
- Other expenses – not related to actual production
- Scheduled debt payments – includes principal and interest payments for each separate loan.
Note: All expenses are summed to obtain total cash outflow.
- Cash available – this is the difference between Total cash inflow and total cash outflow
- New borrowing – if the cash available is negative, this means that there is insufficient cash generated during the period to meet all cash obligations and additional borrowing is needed for that time period.
- Cash balance – obtained by adding cash available to new borrowing. It becomes the beginning cash balance at the start of next time period. This must always be positive
- Debt outstanding – an accounting of the debt outstanding for each loan is kept at the bottom of the cash flow budget. Therefore, principal payments in a time can be subtracted out of the balance owed.
Table 2: An annual Cash Flow budget for a hypothetical fully operational tilapia /catfish farm
- Farm size: 0.5 Ha
- Productivity: 3 kg/m2/year
- Av price of fish in KES/Kg: 250
| Item | Yr 0 | Yr 1 | Yr 2 | Yr 3 | Yr 4 | Yr 5 | Yr 6 |
| Beginning cash Balance | 100,000 | 732,000 | 1,364,000 | 1,996,000 | 2,628,000 | 3,260,000 | |
| Tilapia | 2,400,000 | 2,400,000 | 2,400,000 | 2,400,000 | 2,400,000 | 2,400,000 | |
| Catfish | 900,000 | 900,000 | 900,000 | 900,000 | 900,000 | 900,000 | |
| Total Cash inflow | 3,400,000 | 4,032,000 | 4,664,000 | 5,296,000 | 5,928,000 | 6,560,000 | |
| Operating cash expenses | |||||||
| Tilapia fingerlings | 50,000 | 50,000 | 50,000 | 50,000 | 50,000 | 50,000 | |
| Catfish fingerlings | 900,000 | 900,000 | 900,000 | 900,000 | 900,000 | 900,000 | |
| Wheat bran | 1,050,000 | 1,050,000 | 1,050,000 | 1,050,000 | 1,050,000 | 1,050,000 | |
| Fertilizers | 6,500 | 6,500 | 6,500 | 6,500 | 6,500 | 6,500 | |
| 13,500 | 13,500 | 13,500 | 13,500 | 13,500 | 13,500 | ||
| Lime | 26,000 | 26,000 | 26,000 | 26,000 | 26,000 | 26,000 | |
| Interest on operation loan | 60,000 | 60,000 | 60,000 | 60,000 | 60,000 | 60,000 | |
| Total Operating cash expenses | 2,406,000 | 2,406,000 | 2,406,000 | 2,406,000 | 2,406,000 | 2,406,000 | |
| Living expenses | 100,000 | 100,000 | 100,000 | 100,000 | 100,000 | 100,000 | |
| Other expenses | 50,000 | 50,000 | 50,000 | 50,000 | 50,000 | 50,000 | |
| Scheduled debt repayments | |||||||
| Interest on Investment loan | 12% | 150,000 | 120,000 | 90,000 | 60,000 | 30,000 | |
| Repayment | 5 yrs | 250,000 | 250,000 | 250,000 | 250,000 | 250,000 | |
| Operating principle | 100,000 | 100,000 | 100,000 | 100,000 | 100,000 | 100,000 | |
| Interest on operation loan | 12% | 12,000 | 12,000 | 12,000 | 12,000 | 12,000 | 12,000 |
| Total Cash Outflow | 2,668,000 | 2,668,000 | 2,668,000 | 2,668,000 | 2,668,000 | 2,668,000 | |
| Cash available | 732,000 | 1,364,000 | 1,996,000 | 2,628,000 | 3,260,000 | 3,892,000 | |
| New Borrowing | |||||||
| Cash Balance | 732,000 | 1,364,000 | 1,996,000 | 2,628,000 | 3,260,000 | 3,892,000 | |
| Outstanding debts | |||||||
| Investment | 1,250,000 | 1,000,000 | 750,000 | 500,000 | 250,000 | 0.0 |